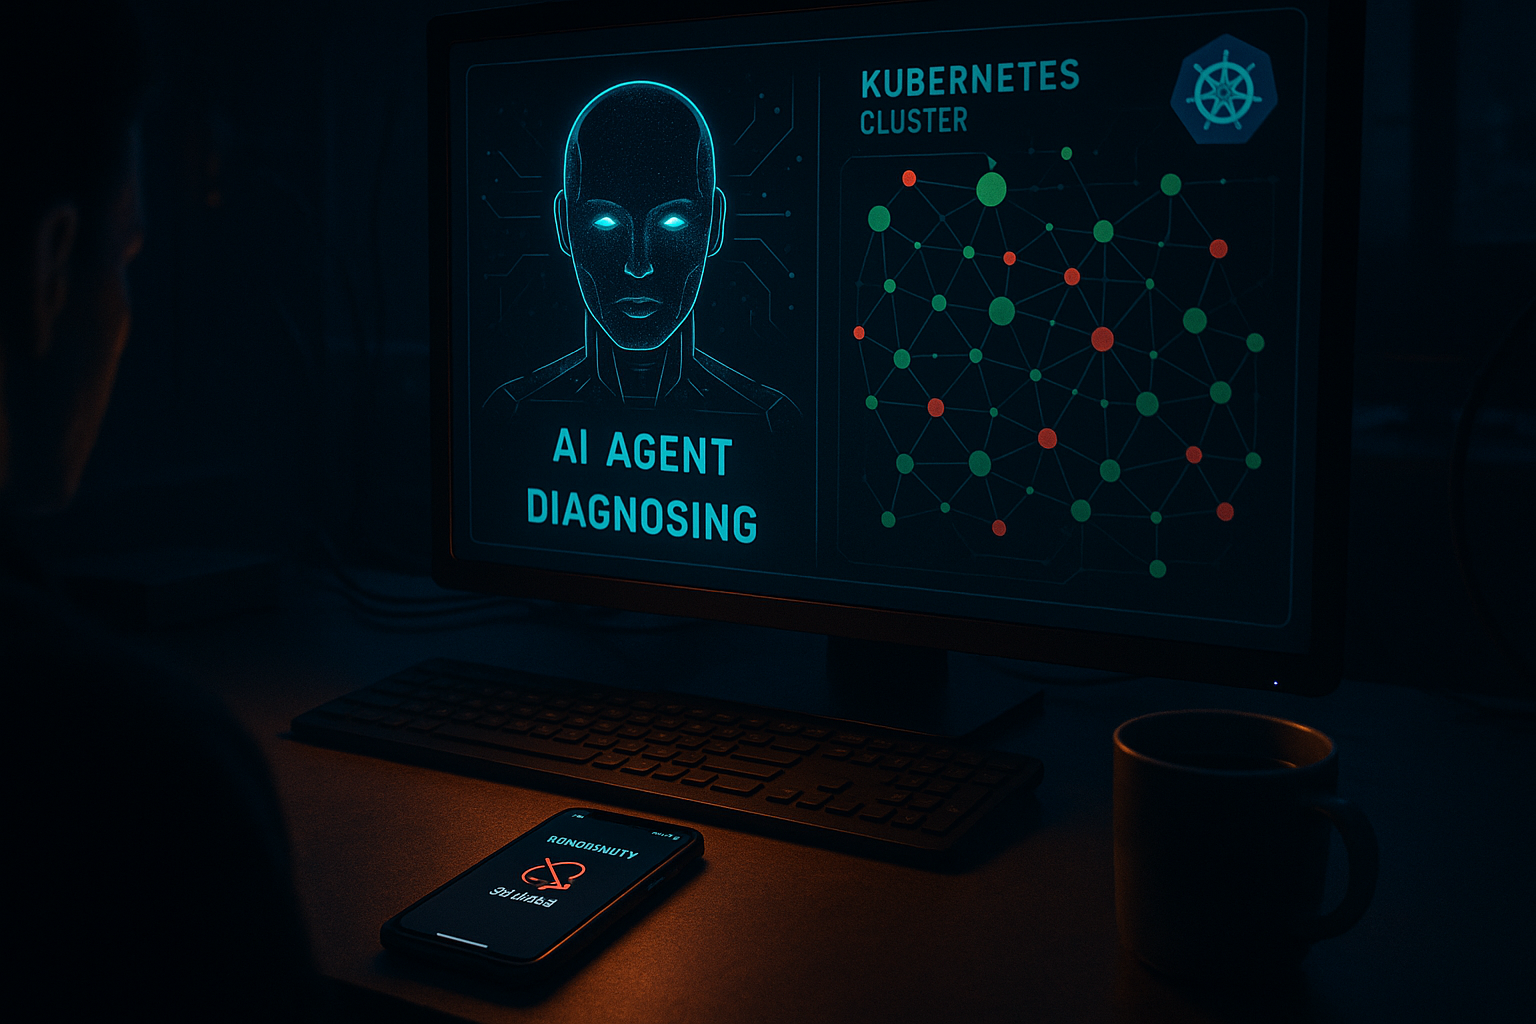
Your phone buzzes at 2 AM. PagerDuty. A Kubernetes pod is crash-looping in production. You groggily open your laptop, SSH into the cluster, start running kubectl describe commands, and spend 45 minutes diagnosing something that turns out to be a misconfigured memory limit. Again.
This is the on-call engineering tax that every team pays — and it's brutal. But right now, on Hacker News and across DevOps Slack communities, a serious conversation is happening: AI agents are starting to handle first-response Kubernetes incidents autonomously. Not perfectly. Not without oversight. But well enough that some teams are cutting their mean time to resolution (MTTR) in half and letting engineers actually sleep.
Let me show you what's actually working, why it's blowing up now, and how to build a basic version yourself.
Why This Is Exploding Right Now
Three things converged at once:
1. LLMs got good at tool use. Function calling and structured tool invocation — the backbone of any useful agentic workflow — matured enough that agents can reliably call kubectl, query Prometheus, read logs, and make decisions across multiple steps without falling apart.
2. Kubernetes runbooks are actually structured knowledge. Unlike open-ended software engineering tasks, incident response has patterns. OOMKilled means check memory limits. CrashLoopBackOff means check logs and exit codes. ImagePullBackOff means check credentials or image name. This is exactly the kind of procedural, step-by-step reasoning that LLMs handle well.
3. The on-call problem is genuinely unsustainable. With platform teams shrinking and microservice counts growing, the alert-to-engineer ratio is getting worse. Teams are desperate for anything that handles tier-1 incidents without waking a human.
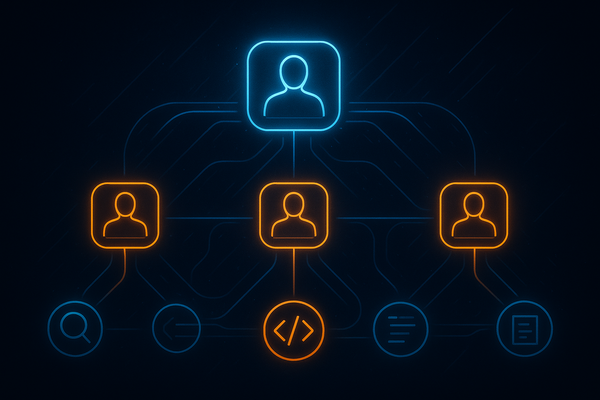
What an AI On-Call Agent Actually Does
Think of it as a very senior SRE that never sleeps and has perfect recall of your runbooks. When an alert fires, the agent:
- Receives the alert payload (via PagerDuty webhook, Alertmanager, or similar)
- Queries the cluster to understand current state
- Pulls recent logs and events for affected resources
- Checks related metrics in Prometheus/Grafana
- Cross-references your runbook knowledge base
- Attempts a remediation action (or escalates with a full diagnostic summary)
- Posts a detailed incident report to Slack
The critical design decision: the agent should always escalate with context rather than silently fail. Even if it can't fix the problem, waking you up with a complete diagnosis is 10x more valuable than waking you up cold.
The Architecture
Here's the stack that's emerging as the practical standard:
- Agent framework: LangGraph or raw function-calling loop (OpenAI/Anthropic)
- Tools: kubectl wrapper, Prometheus HTTP API, log aggregator (Loki/CloudWatch), Slack API
- Knowledge base: Vector store of your runbooks (see semantic search with embeddings)
- Memory: Incident history for pattern recognition (see persistent agent memory)
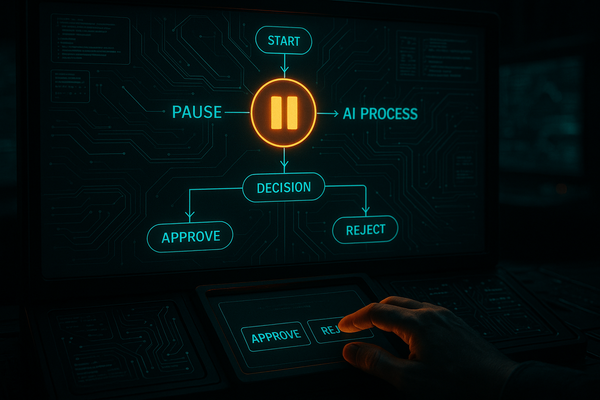
- Safety layer: Approval gates for destructive actions
The safety layer is non-negotiable. Read our piece on AI agent production safety before you deploy anything that touches your cluster.
Let's Build It: A Minimal K8s Incident Agent
Here's a working skeleton using OpenAI function calling. This handles the most common Kubernetes failure modes.
Step 1: Define the tools
import subprocess
import json
import requests
from openai import OpenAI

client = OpenAI()

# Tool definitions for the agent
tools = [
    {
        "type": "function",
        "function": {
            "name": "kubectl_get",
            "description": "Run kubectl get command to inspect Kubernetes resources",
            "parameters": {
                "type": "object",
                "properties": {
                    "resource": {"type": "string", "description": "Resource type: pods, deployments, services, events"},
                    "namespace": {"type": "string", "description": "Kubernetes namespace"},
                    "name": {"type": "string", "description": "Resource name (optional)"},
                    "output": {"type": "string", "description": "Output format: json, yaml, wide"}
                },
                "required": ["resource", "namespace"]
            }
        }
    },
    {
        "type": "function",
        "function": {
            "name": "get_pod_logs",
            "description": "Fetch recent logs from a Kubernetes pod",
            "parameters": {
                "type": "object",
                "properties": {
                    "pod_name": {"type": "string"},
                    "namespace": {"type": "string"},
                    "tail_lines": {"type": "integer", "default": 100},
                    "previous": {"type": "boolean", "description": "Get logs from previous crashed container"}
                },
                "required": ["pod_name", "namespace"]
            }
        }
    },
    {
        "type": "function",
        "function": {
            "name": "kubectl_describe",
            "description": "Describe a Kubernetes resource for detailed status and events",
            "parameters": {
                "type": "object",
                "properties": {
                    "resource": {"type": "string"},
                    "name": {"type": "string"},
                    "namespace": {"type": "string"}
                },
                "required": ["resource", "name", "namespace"]
            }
        }
    },
    {
        "type": "function",
        "function": {
            "name": "query_prometheus",
            "description": "Query Prometheus for metrics",
            "parameters": {
                "type": "object",
                "properties": {
                    "query": {"type": "string", "description": "PromQL query string"},
                    "time_range": {"type": "string", "description": "Time range like 5m, 1h, 24h"}
                },
                "required": ["query"]
            }
        }
    },
    {
        "type": "function",
        "function": {
            "name": "escalate_to_human",
            "description": "Escalate incident to on-call human with full diagnostic context",
            "parameters": {
                "type": "object",
                "properties": {
                    "severity": {"type": "string", "enum": ["low", "medium", "high", "critical"]},
                    "summary": {"type": "string"},
                    "findings": {"type": "string"},
                    "recommended_action": {"type": "string"}
                },
                "required": ["severity", "summary", "findings"]
            }
        }
    }
]
Step 2: Implement the tool execution layer
def execute_tool(tool_name: str, args: dict) -> str:
    if tool_name == "kubectl_get":
        cmd = ["kubectl", "get", args["resource"], "-n", args["namespace"]]
        if args.get("name"):
            cmd.append(args["name"])
        if args.get("output"):
            cmd.extend(["-o", args["output"]])
        result = subprocess.run(cmd, capture_output=True, text=True, timeout=30)
        return result.stdout or result.stderr

    elif tool_name == "get_pod_logs":
        cmd = ["kubectl", "logs", args["pod_name"], "-n", args["namespace"],
               "--tail", str(args.get("tail_lines", 100))]
        if args.get("previous"):
            cmd.append("--previous")
        result = subprocess.run(cmd, capture_output=True, text=True, timeout=30)
        return result.stdout or result.stderr

    elif tool_name == "kubectl_describe":
        cmd = ["kubectl", "describe", args["resource"], args["name"], "-n", args["namespace"]]
        result = subprocess.run(cmd, capture_output=True, text=True, timeout=30)
        return result.stdout or result.stderr

    elif tool_name == "query_prometheus":
        # Adjust URL to your Prometheus endpoint
        prometheus_url = "http://prometheus:9090"
        params = {"query": args["query"]}
        try:
            resp = requests.get(f"{prometheus_url}/api/v1/query", params=params, timeout=10)
            return json.dumps(resp.json().get("data", {}))
        except Exception as e:
            return f"Prometheus query failed: {str(e)}"

    elif tool_name == "escalate_to_human":
        # In production: trigger PagerDuty + post to Slack
        message = f"""🚨 ESCALATION [{args['severity'].upper()}]
**Summary**: {args['summary']}
**Findings**: {args['findings']}
**Recommended Action**: {args.get('recommended_action', 'Manual investigation required')}"""
        print(message)  # Replace with actual Slack/PagerDuty call
        return "Escalation sent to on-call engineer"

    return f"Unknown tool: {tool_name}"
Step 3: The agent loop
SYSTEM_PROMPT = """You are an expert SRE agent responding to Kubernetes incidents.
Your job is to diagnose the root cause and either remediate it or escalate with full context.

For every incident:
1. Check the affected resource status
2. Inspect recent events and logs
3. Check related metrics if relevant
4. Identify root cause from these patterns:
   - OOMKilled → memory limit too low or memory leak
   - CrashLoopBackOff → check exit code in logs
   - ImagePullBackOff → image name wrong or registry credentials expired
   - Pending → node resources exhausted or PVC not bound
   - Evicted → node memory/disk pressure
5. Either remediate (only safe actions) or escalate with complete findings.

Never make destructive changes. Always escalate if uncertain."""

def run_incident_agent(alert: dict) -> str:
    incident_description = f"""
    INCIDENT ALERT:
    - Alert Name: {alert.get('alertname')}
    - Namespace: {alert.get('namespace')}
    - Pod: {alert.get('pod', 'unknown')}
    - Severity: {alert.get('severity')}
    - Description: {alert.get('description')}
    - Started: {alert.get('startsAt')}
    """

    messages = [
        {"role": "system", "content": SYSTEM_PROMPT},
        {"role": "user", "content": incident_description}
    ]

    max_iterations = 10  # Safety limit
    iteration = 0

    while iteration < max_iterations:
        iteration += 1
        response = client.chat.completions.create(
            model="gpt-4o",
            messages=messages,
            tools=tools,
            tool_choice="auto"
        )

        message = response.choices[0].message
        messages.append(message)

        # No more tool calls — agent is done
        if not message.tool_calls:
            return message.content

        # Execute each tool call
        for tool_call in message.tool_calls:
            tool_name = tool_call.function.name
            args = json.loads(tool_call.function.arguments)

            print(f"[Agent] Calling tool: {tool_name} with {args}")
            result = execute_tool(tool_name, args)

            messages.append({
                "role": "tool",
                "tool_call_id": tool_call.id,
                "content": result
            })

    return "Max iterations reached. Escalating for manual review."


# Example usage — triggered by Alertmanager webhook
example_alert = {
    "alertname": "KubePodCrashLooping",
    "namespace": "production",
    "pod": "payment-service-7d9f4b-xkp2m",
    "severity": "critical",
    "description": "Pod has been crash looping for 15 minutes",
    "startsAt": "2026-05-27T02:14:00Z"
}

result = run_incident_agent(example_alert)
print(result)
What the Agent Handles Well (and What It Doesn't)
Handles well:
- OOMKilled diagnosis and memory limit recommendations
- CrashLoopBackOff root cause from log analysis
- ImagePullBackOff identification
- Generating detailed incident summaries for human review
- Checking if issues are widespread vs. isolated
Still needs humans:
- Anything requiring cluster-wide changes
- Novel failure modes not in runbooks
- Application-level bugs (the infra is fine, the code is broken)
- Multi-service cascading failures requiring system-wide context
This is a tier-1 responder, not a replacement for your SRE team. The goal is that 40-60% of alerts get fully resolved or triaged before a human wakes up.
Production Considerations You Can't Skip
RBAC lockdown. The agent's service account should have read-only access to most resources, with write access only to safe remediation actions (restart a deployment, not delete a namespace). Least privilege is critical here.
Audit logging. Every kubectl command the agent runs should be logged with the full incident context. You need this for post-mortems and for debugging why the agent did something unexpected.
Approval gates for destructive actions. Want the agent to restart a deployment? Post a Slack message with an approve/reject button. Only execute on approval. This hybrid human-in-the-loop pattern gives you speed without catastrophic risk.
Timeout everything. subprocess calls, Prometheus queries, LLM calls — all need hard timeouts. An agent that hangs during an incident is worse than no agent.
Cost awareness. GPT-4o with 10 tool call iterations per incident adds up. For high-volume alert environments, consider using a cheaper model for initial triage and only escalating to GPT-4o for complex cases. See our guide on reducing OpenAI API costs.
The Bigger Picture
This isn't just a cool demo. Teams at companies like Cortex, Incident.io, and various stealth startups are shipping this in production today. The HN thread that sparked this trend showed engineers reporting 60% reduction in 2 AM pages and MTTR dropping from 45 minutes to under 10 for common failure patterns.
The on-call engineering role is not going away. But the tier-1, pattern-matching, runbook-execution part of that role? That's automatable right now, with tools that exist today, deployed in a weekend.
The engineers who build these systems aren't replacing their teams — they're making their teams' lives dramatically better. And in a market where on-call burnout is a top reason senior engineers quit, that's not just a technical win. It's a retention strategy.
Start small. Pick your three most common alert types. Write the runbook logic into the system prompt. Add the kubectl tools. Test it on staging alerts. Deploy with read-only permissions first. Then iterate.
The 2 AM pages aren't going to stop. But they can stop waking you up for the ones that don't need you.